
Dutch TTF natural gas max exposure study
Systematic trend performance at max exposure
Traditional systematic Trend Following strategies progressively build exposure as a trend develops, adding length as prices move higher or short exposure as prices move lower. Once maximum deployment is reached, the strategy is fully positioned and the focus shifts to managing the trade through its stop logic.
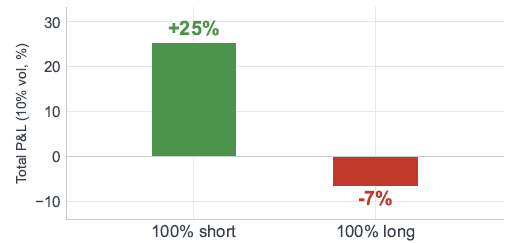
Historically, performance at maximum exposure in TTF has differed significantly by direction:
- 100% short: +25% cumulative P&L
- 100% long: -7% cumulative P&L
Cumulative P&L at maximum exposure: long vs. short
This difference does not appear to result from CTAs reaching maximum long exposure after the upward price move has already run its course. Looking at the performance of individual max-long periods shows that the models typically continued to generate positive P&L after reaching full deployment, but retained substantially less of those gains by the time the positions were exited.
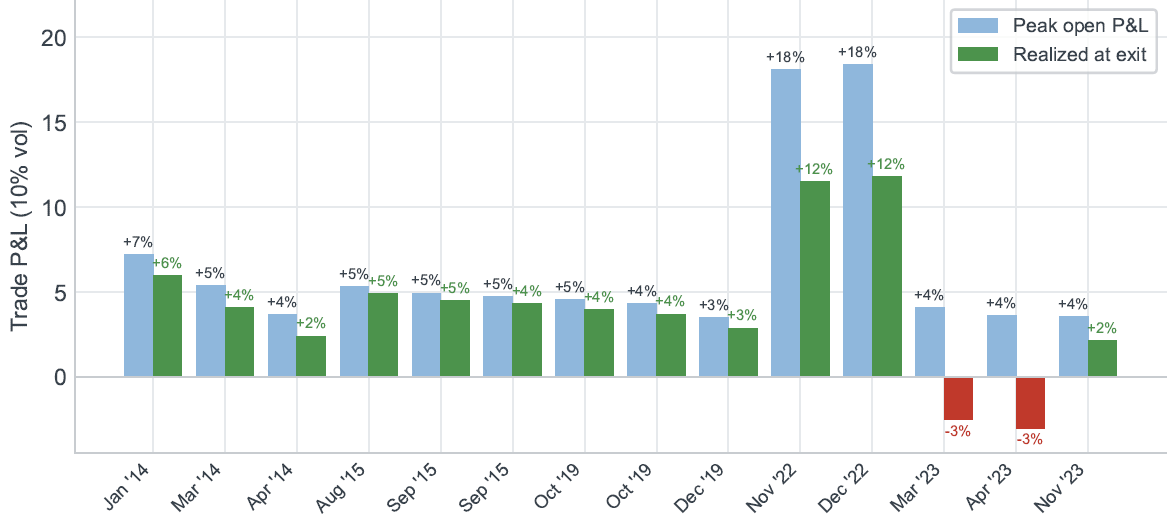
P&L during maximum-long periods: peak vs. realized at full exit
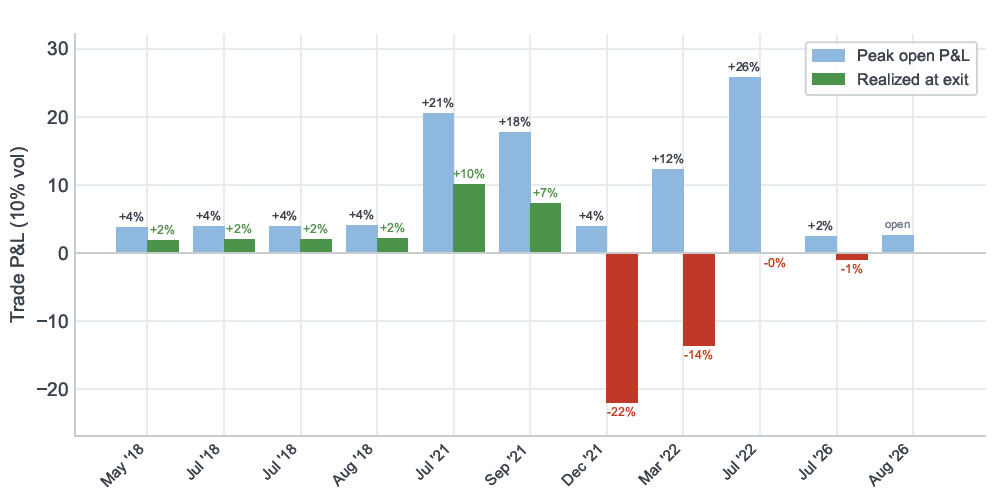
The negative overall performance of 100% long positions does not mean the upward move was already exhausted when maximum exposure was reached. Historically:
- Average peak open P&L: +10.6%
- Average realized P&L at exit: -1.2%
Those gains were not retained through exit. Average realized P&L was -1.2%, meaning the average max-long position not only gave back its peak gains, but ultimately exited at a loss.
P&L during maximum-short periods: peak vs. realized at full exit
Maximum-short periods show a materially different pattern:
- Average peak open P&L: +6.5%
- Average realized P&L at exit: +1.7%
The difference between long and short performance reflects how much P&L is retained through exit, rather than an absence of profitable price movement after reaching maximum exposure.
How trend strategies manage exits
The divergence in profit retention is linked to how the trend-following strategies manage exits. The models use dynamic trailing stops designed to remain with an established trend while protecting against a sustained reversal.
When a position is established, the initial stop takes prevailing market volatility into account, allowing room for normal price movement. From there, the stop trails the position dynamically, adjusting over the life of the trade based on factors including time and changes in volatility.
Distance to nearest exit level at maximum exposure
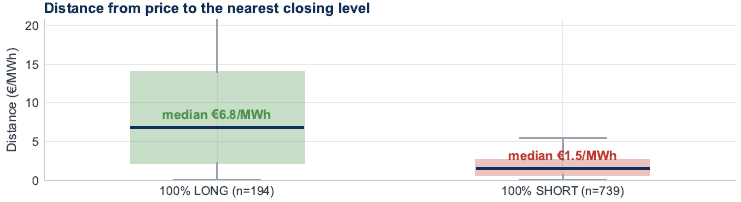
Historically, maximum-long periods have occurred in a very different volatility environment than maximum-short periods:
- Median distance to nearest exit
- 100% long: €6.8/MWh
- 100% short: €1.5/MWh
- Median 14-day ATR
- 100% long: €2.7/MWh
- 100% short: €0.5/MWh
Higher volatility during max-long periods produces wider modelled exits, giving prices more room to reverse before exposure begins to be reduced. This allows a greater portion of accumulated profits to be given back before exit.
Market volatility at maximum exposure
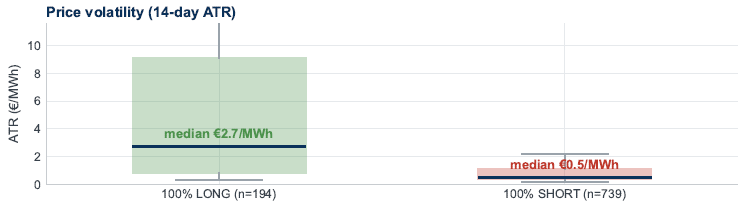
Because the strategies set and adjust their exit levels based on market volatility, these higher-volatility environments result in wider exits. The models can tolerate a larger price reversal before reducing exposure, allowing more of the profits accumulated during the upward trend to be given back before exit.
Current TTF Trend Positioning
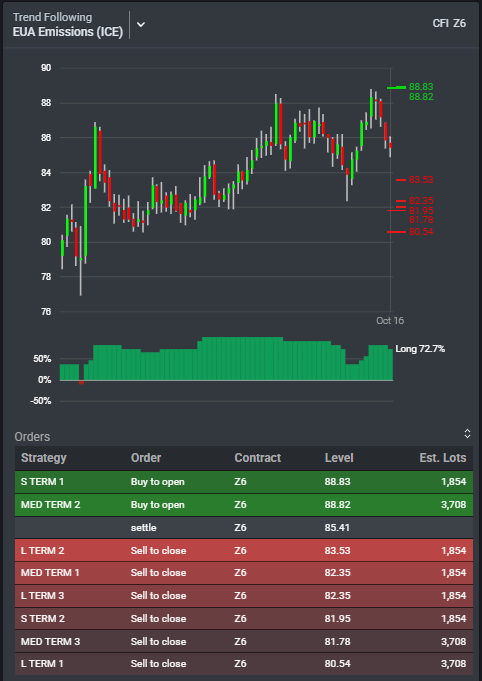
TTF is currently 100% long, with the same characteristics historically associated with greater profit giveback:
- Current nearest exit: €7.5/MWh below market
- Historical max-long median: €6.8/MWh below market
- Current exit distance: wider than historical median
- Volatility: also above the historical max-long median
The current setup naturally leaves more room than usual for prices to move lower before modelled CTA selling begins.
Kpler Financial Flows (formerly Bridgeton Research Group), quantifies where algorithmic trading flows may accelerate or unwind, with multi asset coverage across agriculture, energy, metals, power, gas, softs and financials.
- Data back to 2014
- 400+ Market tickers
- 0.9+ Correlation to key benchmarks

See why the most successful traders and shipping experts use Kpler

Actionable insights into algorithmic trading behaviour