Get actionable insights into algorithmic trading behaviour across global futures markets
trusted by thousands of organisations worldwide


.webp)


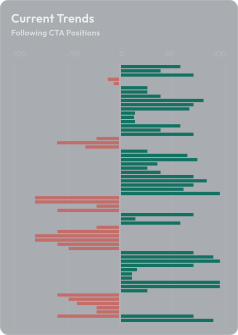
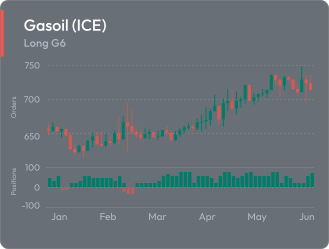
- Access daily systematic CTA flow estimates with explicit trade direction, order size, and positioning updates
- Anticipate when systematic flows are likely to enter the market
- Time entries and exits with clearer visibility into flow-driven market pressure
Request demo

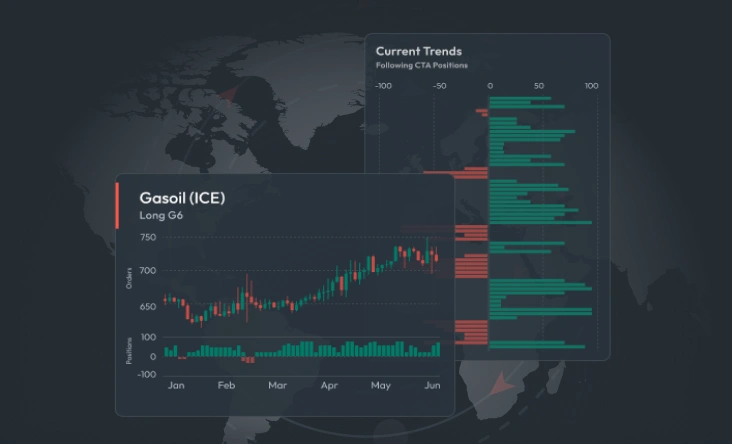
- View daily systematic CTA positioning across various strategy types
- Track aggregate financial flow exposure and consensus across assets and factors
- Align with prevailing systematic positioning — or lean against it — with confidence and transparency.
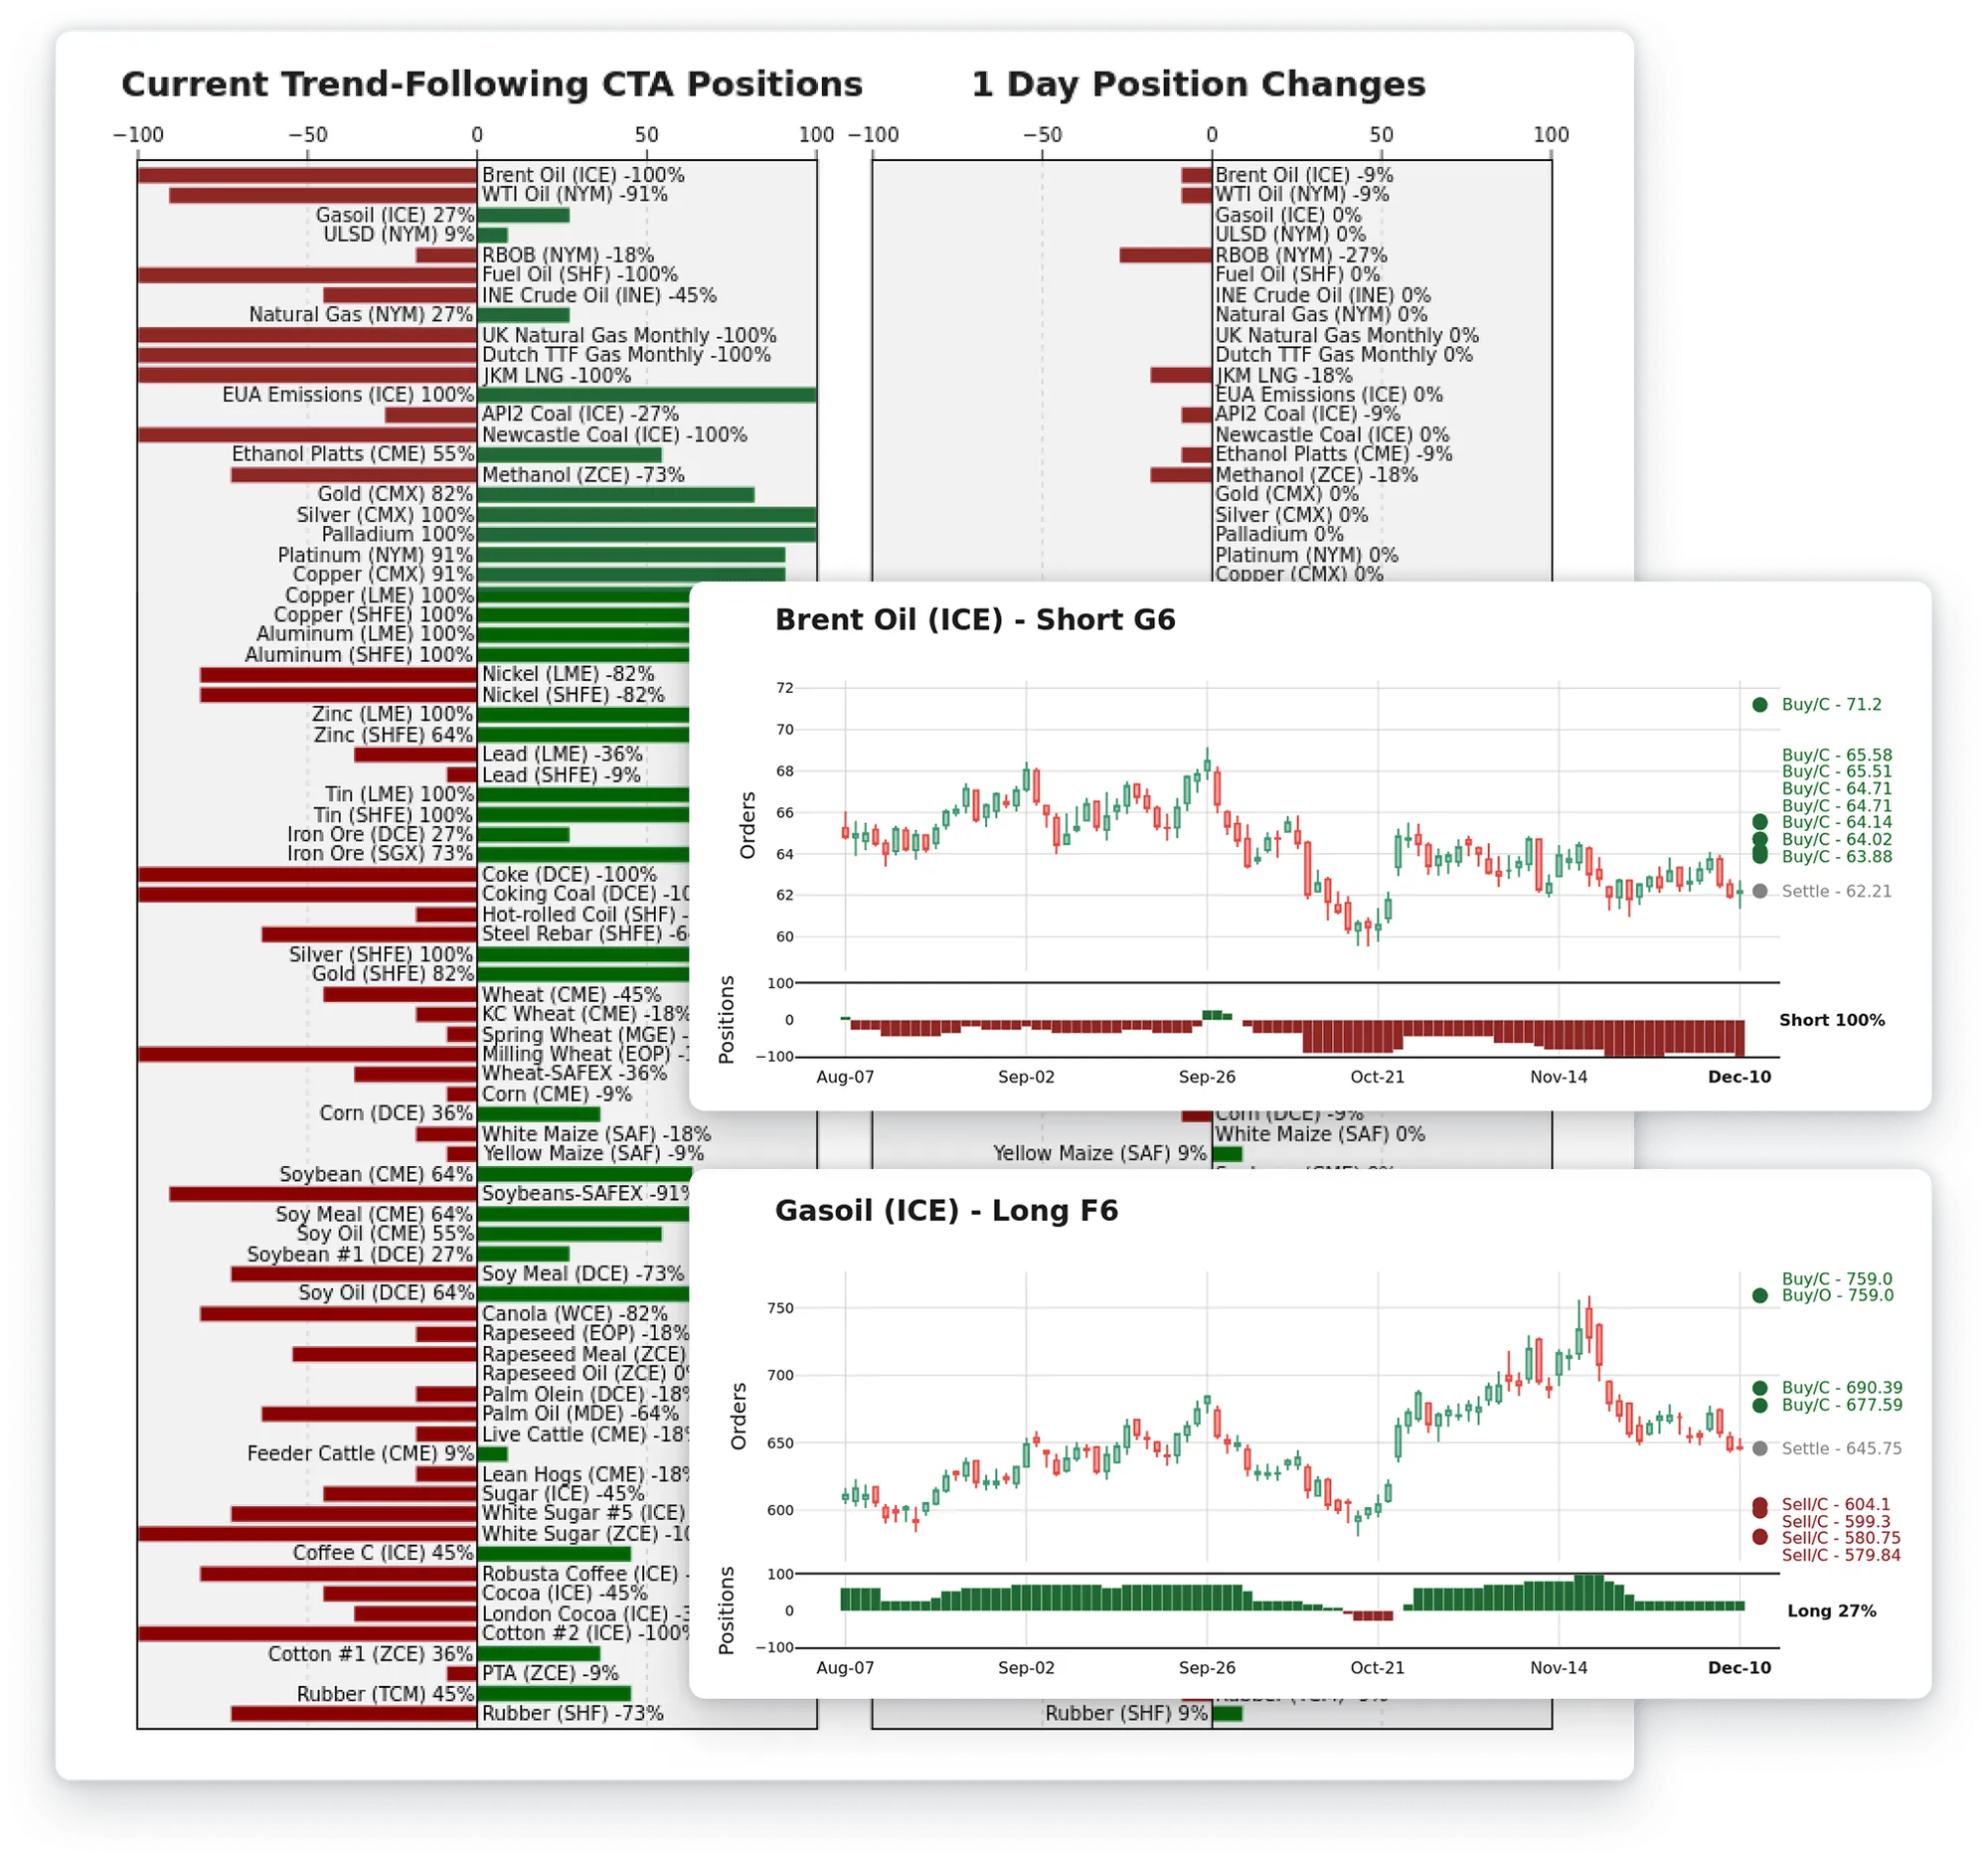
- Monitor systematic flows across multiple strategy types to identify congestion points before liquidity becomes constrained
- Track positioning and flow dispersion across the curve, revealing where systematic exposure is concentrated and where risk is building
- Enhance risk management by contextualising systematic exposure across evolving market regimes
Request demo

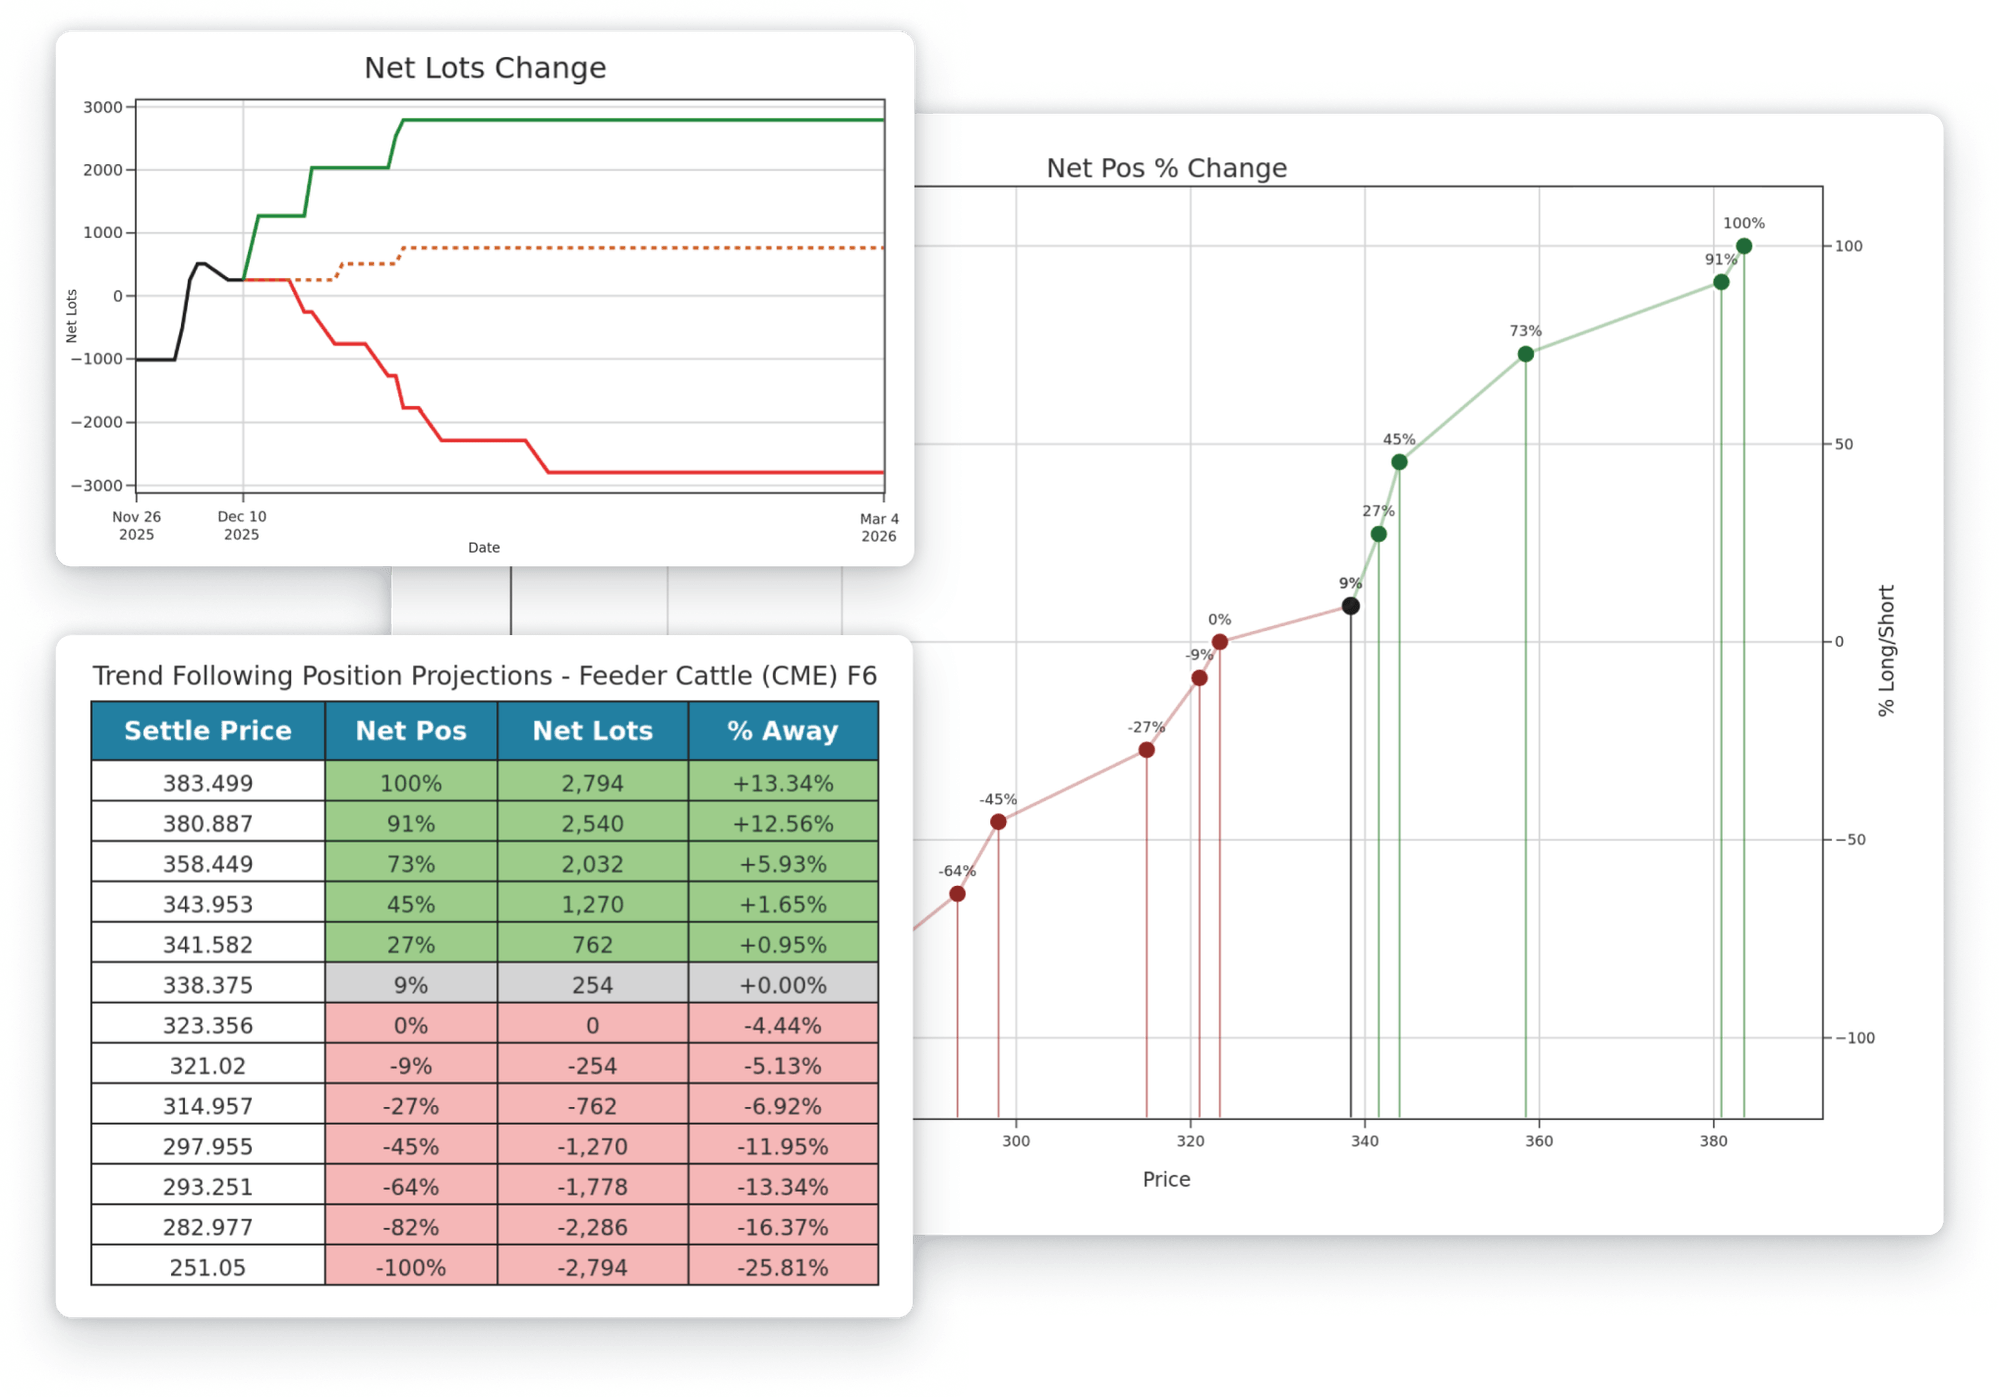
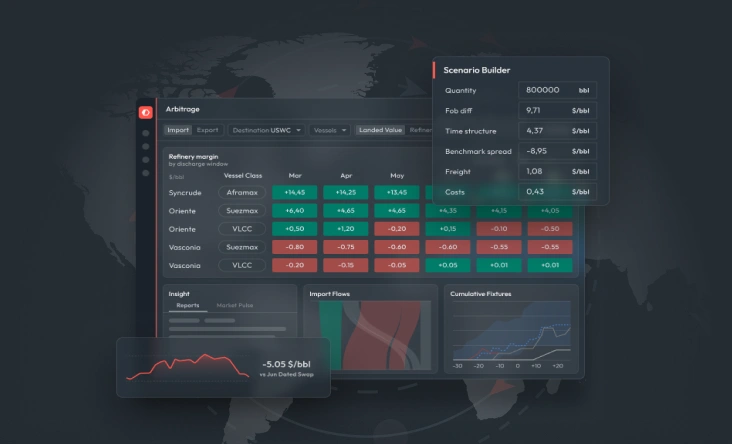
- Quantify how flow magnitude, order size, and execution intensity evolve across scenarios
- Identify inflection points where financial flows are likely to accelerate or unwind
- Manage exposure through structural shifts in systematic behaviour
Request demo
- Track how replicated CTA strategies are performing in real time, linking positioning, execution, and realised market impact
- Validate flow signals by comparing model outputs to observed performance and historical CTA behaviour
- Cross-check systematic, discretionary, and commercial participation using disaggregated Commitment of Traders data.
Request demo
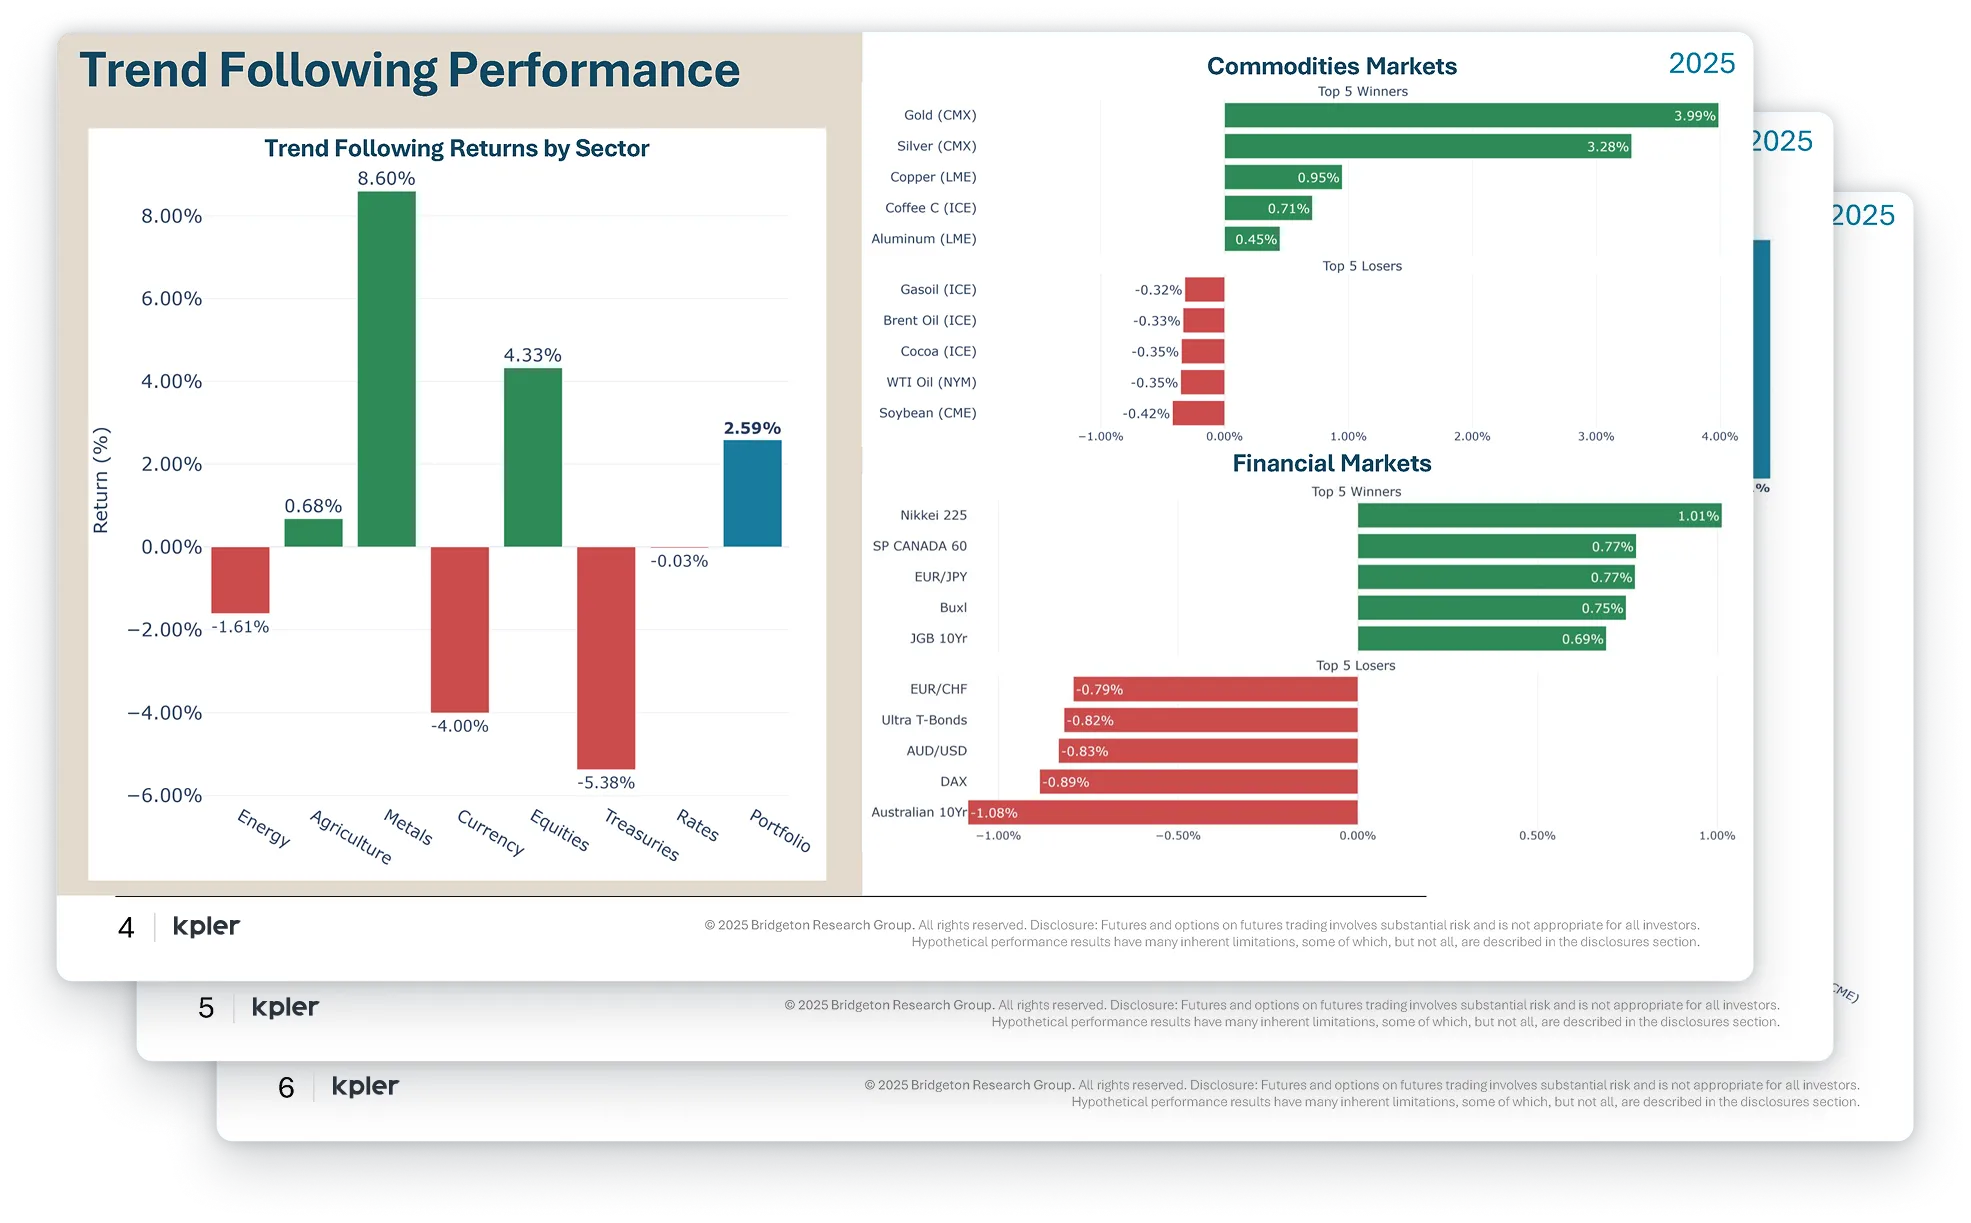
Kpler evaluates the accuracy of its Financial Flows product by correlating derived flow signals against leading CTA benchmarks, providing a quantitative framework to assess how closely modelled financial activity reflects the performance and structure of systematic managed futures strategies.
Request demo

“Kpler is one of the few truly objective research outfits. No agenda, just data-driven insights.”
BNP Paribas
Commodity Strategist, BNP Paribas