From congestion to corridor realignment: How the Mombasa crisis is reshaping East African container trade
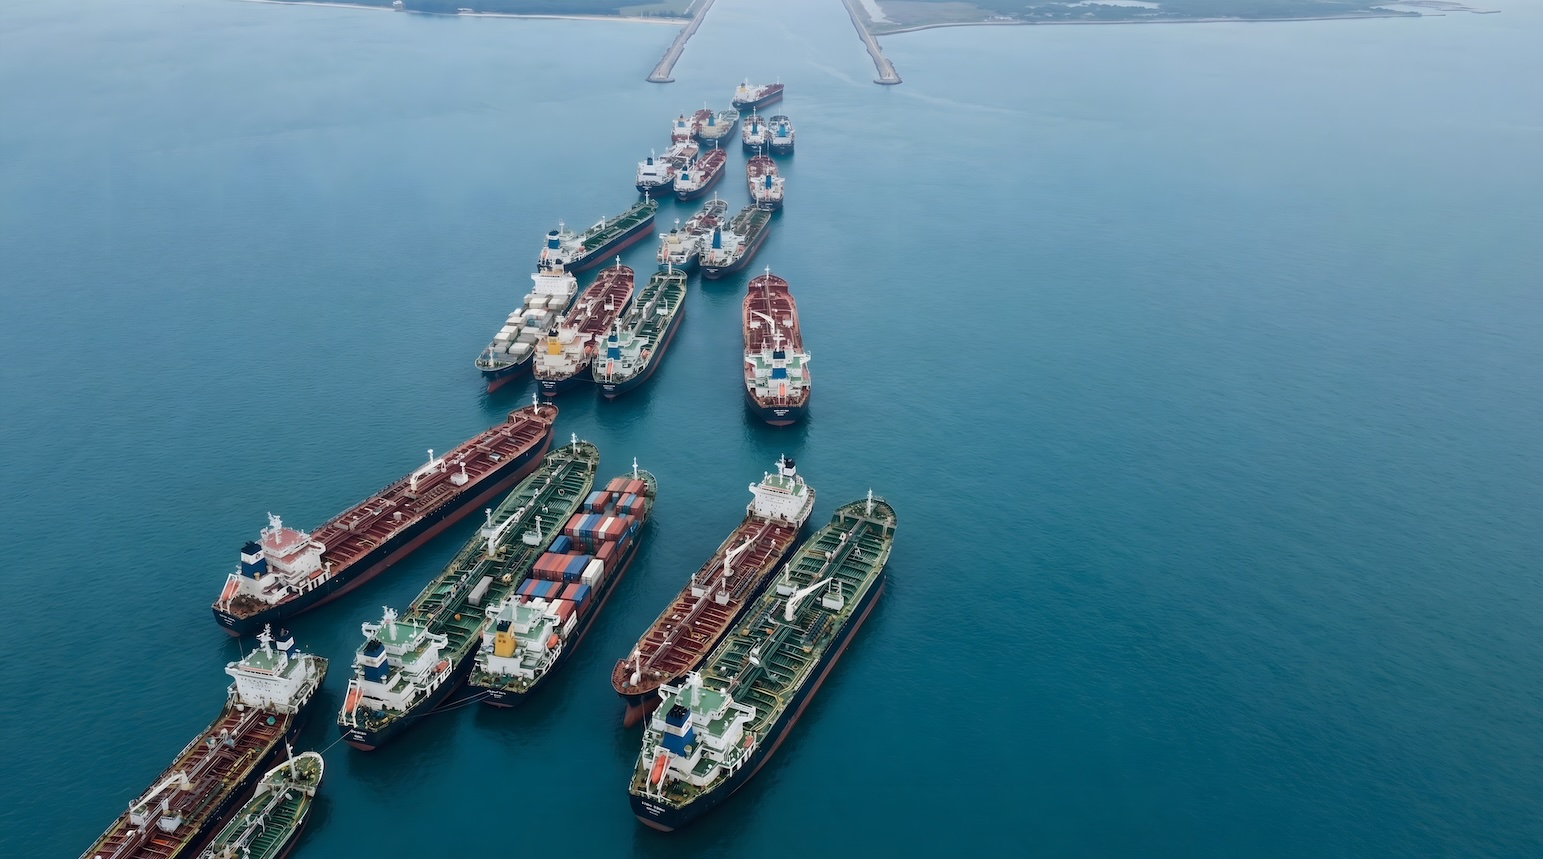
Since September 2025, the Port of Mombasa has become a focal point of concern for the global maritime industry. Reports describe a "perfect storm" of disruption—over 20 vessels idling at anchorage and berth delays stretching up to 14 days. Yet these headlines rarely capture the structural evolution occurring beneath the surface.
Using Kpler’s Container Intelligence, we move beyond port-level averages to analyse terminal-specific data across the KPA Container Terminal, Kipevu Container Terminal, and Dar es Salaam Port. Our findings reveal more than a congestion crisis—they signal a fundamental structural shift in East African trade corridors that demands attention from shippers, forwarders, and carriers alike.
Overview of port congestion in East Africa
In East Africa, congestion has traditionally been viewed as a temporary disruption caused by seasonal surges, labor disputes, or equipment failures.
However, Mombasa's current situation represents something different. The convergence of truck driver strikes, empty container bottlenecks, and infrastructure limitations has created chronic delays that are reshaping regional trade patterns. Landlocked nations—including Uganda, Rwanda, South Sudan, and the Democratic Republic of Congo—depend heavily on these coastal gateways. When one port underperforms, the ripple effects extend thousands of kilometers inland.
Key factors driving East African port congestion
- Empty container imbalances creating yard saturation
- Truck driver strikes disrupting landside operations
- Infrastructure constraints at legacy terminals
- Surging regional demand outpacing capacity investments
- Customs and documentation delays compounding berthing times
A tale of two terminals
In Mombasa, congestion pressure distributes unevenly across facilities. Our analysis reveals a stark contrast between the legacy KPA Container Terminal and the modern Kipevu Container Terminal—insights that port-level averages obscure.
KPA vs. Kipevu performance comparison
The following table summarises performance metrics across three distinct periods from June 2025 through March 2026:
Analytical highlights from terminal data
Waiting incidence patterns:
- KPA consistently shows extremely high waiting incidence (97–100%), indicating structural anchorage congestion that persists regardless of volume
- Kipevu maintains lower waiting incidence and improves in the latest period, dropping to 90%
Waiting time trends:
- KPA waiting times remain elevated even when throughput drops sharply
- Kipevu reduces waiting dramatically in the final phase, from 34.78 hours to 16.95 hours
Volume distribution shifts:
- Kipevu absorbs larger vessels with higher average TEU per call (reaching 4,328 in Phase 3)
- KPA experiences a sharp throughput contraction, with vessel calls falling from 32 to 14
Berth staying time differences:
- Kipevu consistently maintains longer berth stays, suggesting heavier move counts or more intensive handling operations
- KPA berth times decline in Phase 3, likely reflecting reduced volume rather than improved efficiency

See why the most successful traders and shipping experts use Kpler
See how terminal-level congestion affects your routes