
How to track unlimited container ships without manual work
The carrier portal is open. Again. Someone on your logistics team is copying an ETA into a spreadsheet, cross-referencing it with a booking confirmation, then logging into two more portals for vessels on different trade lanes. By the time the data is collated, some of it is already out of date.
This is the daily reality for supply chain and freight teams managing container shipments at scale. And as cargo volumes grow, the process doesn't just slow teams down, it becomes a structural liability.
The problem with carrier-dependent tracking
Most logistics teams start with carrier portals. They're free, familiar, and sufficient for a handful of shipments. But carrier portals have fundamental limitations that compound at volume.
Each major container shipping line — MSC, Maersk, CMA CGM, Hapag-Lloyd, Evergreen — maintains its own proprietary portal with its own data format, event naming conventions, and update cadence. A team managing freight across five carriers is effectively maintaining five parallel tracking workflows, none of which speak to each other.
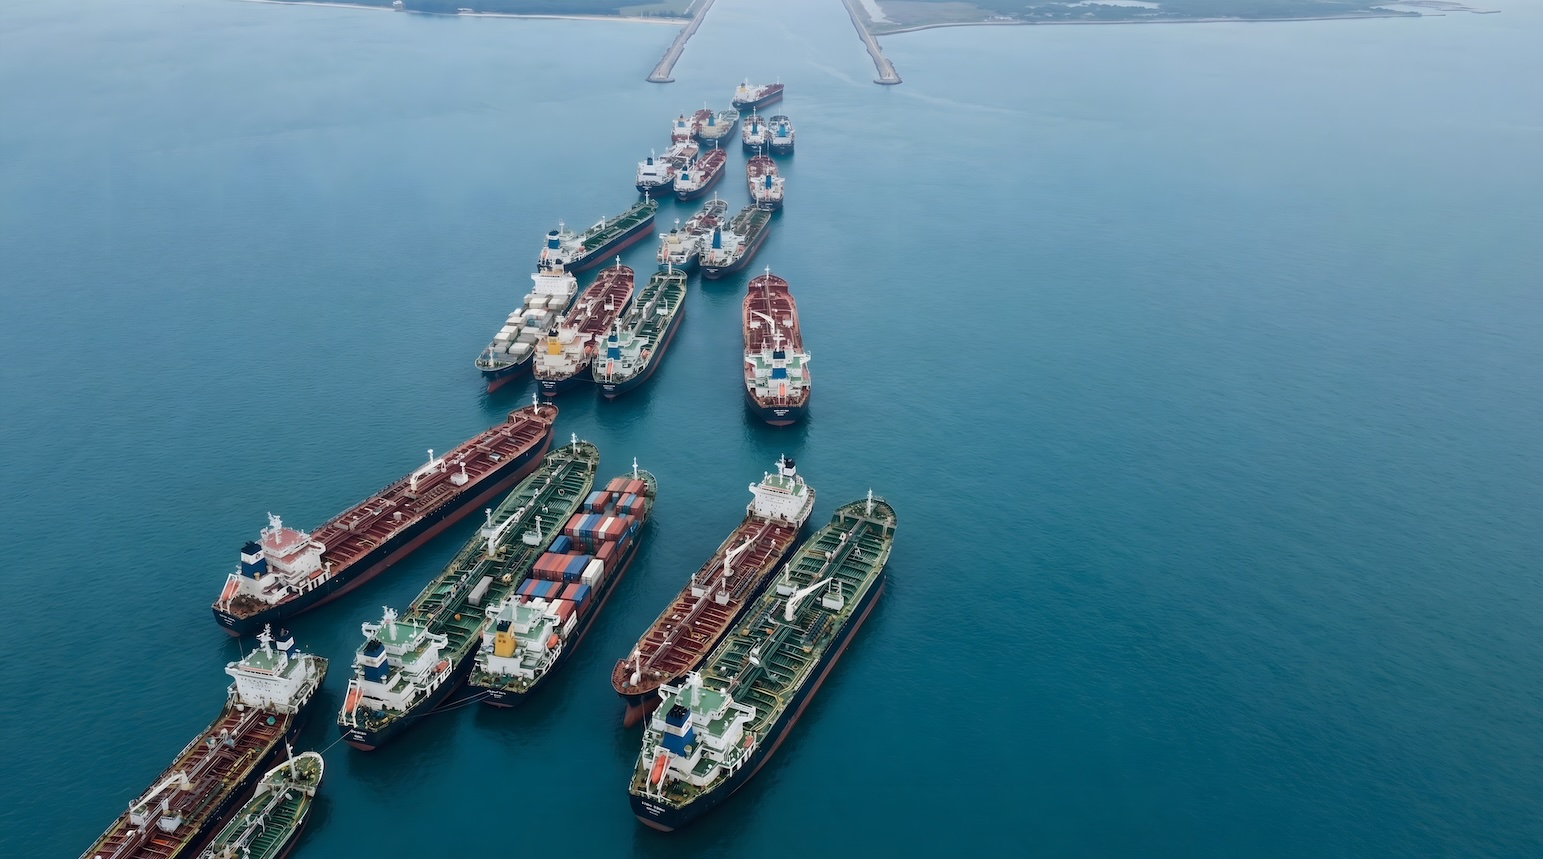
Beyond the fragmentation problem, carrier-reported milestones are only as timely as the carrier chooses to make them. Updates are often event-driven rather than continuous, meaning a vessel can be sitting at anchor outside a congested port for 36 hours before the tracking system reflects any change in status. By then, the downstream decisions — warehouse scheduling, customs pre-clearance, inland haulage booking — have already been made on outdated assumptions.
There's also a data dependency problem. If a carrier's system is delayed, offline, or simply slow to ingest terminal data, the shipper's visibility disappears. Teams fill the gap the only way they can: manually.
Why manual tracking doesn't scale
The practical ceiling on manual container tracking is surprisingly low. As shipment volumes grow, portal-based tracking becomes a bottleneck and teams spend time on data entry and status checks rather than exception management.
Beyond that threshold, one of two things happens: the team grows headcount to match volume, or shipment visibility degrades. Neither is a sustainable answer for businesses with growing ocean freight programmes.
Manual tracking also introduces lag at precisely the moments it matters most. Port congestion events, vessel schedule changes, and cargo rollovers tend to cascade — one disrupted vessel affects transshipment connections, inland availability, and customer commitments simultaneously. A team checking portals twice a day simply cannot respond at the speed these events require.
What automated container ship tracking actually means
Automated tracking replaces the manual check-and-log cycle with a continuous data pipeline. Instead of a person querying a carrier portal, the system ingests data from multiple independent sources, primarily AIS (Automatic Identification System) vessel position data broadcast by container ships, combined with carrier milestone feeds and terminal-level intelligence.
The distinction between AIS-based tracking and carrier-reported milestones is important. AIS data is generated continuously by the vessel itself, regardless of whether the carrier has processed a departure, arrival, or transshipment event. This means AIS-based platforms can detect that a vessel is anchoring outside a port — a common indicator of berth congestion — hours or days before the carrier records a delay milestone.
Independent AIS coverage maintains visibility even when carrier feeds are delayed or absent. For enterprise teams managing freight on multiple trade lanes simultaneously, this independence is operationally significant.
From reactive to predictive: The role of predictive scheduling
Knowing where a container ship is right now is useful. Knowing where it will be in six weeks (and with what confidence) is what allows teams to stop being reactive.
Predictive scheduling uses AIS position data, historical port call patterns, and terminal performance metrics to generate forward-looking ETAs that go beyond the scheduled arrival the carrier published at booking. These models account for real-world variables: how congested the next port of call currently is, how that terminal typically performs under current load, and how the vessel's current speed and position compare to its expected track.
Leading maritime platforms provide vessel-level and terminal-level predictive schedules up to 6+ weeks ahead. This window is long enough to be genuinely useful for warehouse capacity planning, haulage pre-booking, and supplier communication — decisions that are typically made weeks before a vessel arrives.
Terminal congestion: The data layer most platforms miss
Port-level data is a blunt instrument. Knowing that a major transshipment hub is congested tells you relatively little when that port operates across multiple terminals, each with its own berth availability, wait times, and throughput performance.
Terminal-level congestion data closes this gap. Rather than relying on port averages, it surfaces granular metrics — vessel queue lengths, berth wait times, unserved demand — for individual terminals. This matters because the same voyage may call at one terminal experiencing severe backlogs while adjacent terminals at the same port are operating at normal throughput.
For importers, this level of detail enables pro-active decisions: identifying the least-congested terminals available for transshipment, pushing back on carrier routing choices, or adjusting downstream logistics timing before cargo is affected. Container Intelligence,. For example, includes a normalised congestion index across 1,200+ terminals in 700+ ports globally, scored from 0 (no congestion) to 10 (severe congestion), enabling straightforward comparison across locations regardless of their size.

See why the most successful traders and shipping experts use Kpler

Get predictive and real-time visibility, from vessel to terminal