Terminal & vessel performance data

Independent performance benchmarks derived from vessel behaviour across terminals, not self-reported records.

trusted by thousands of organisations worldwide
Container Intelligence
Valencia
MSC Container Terminal
Valencia

8,700+

Container vessels covered

1,200+

Terminals monitored

6+

Week forward forecast window

770+

Ports monitored

Built for teams that negotiate, operate, and decide

Carrier network & port procurement

‍

Challenges

  • You walk into SLA and port rotation negotiations with only your own operational records. 
  • The terminal disputes every berth time and dwell time figure you present.

‍

Solutions

  • Negotiate terminal SLAs and port rotations with independent benchmark data. 
  • Walk into berth window and rotation discussions with third-party waiting time figures your counterpart can verify.
Request demo
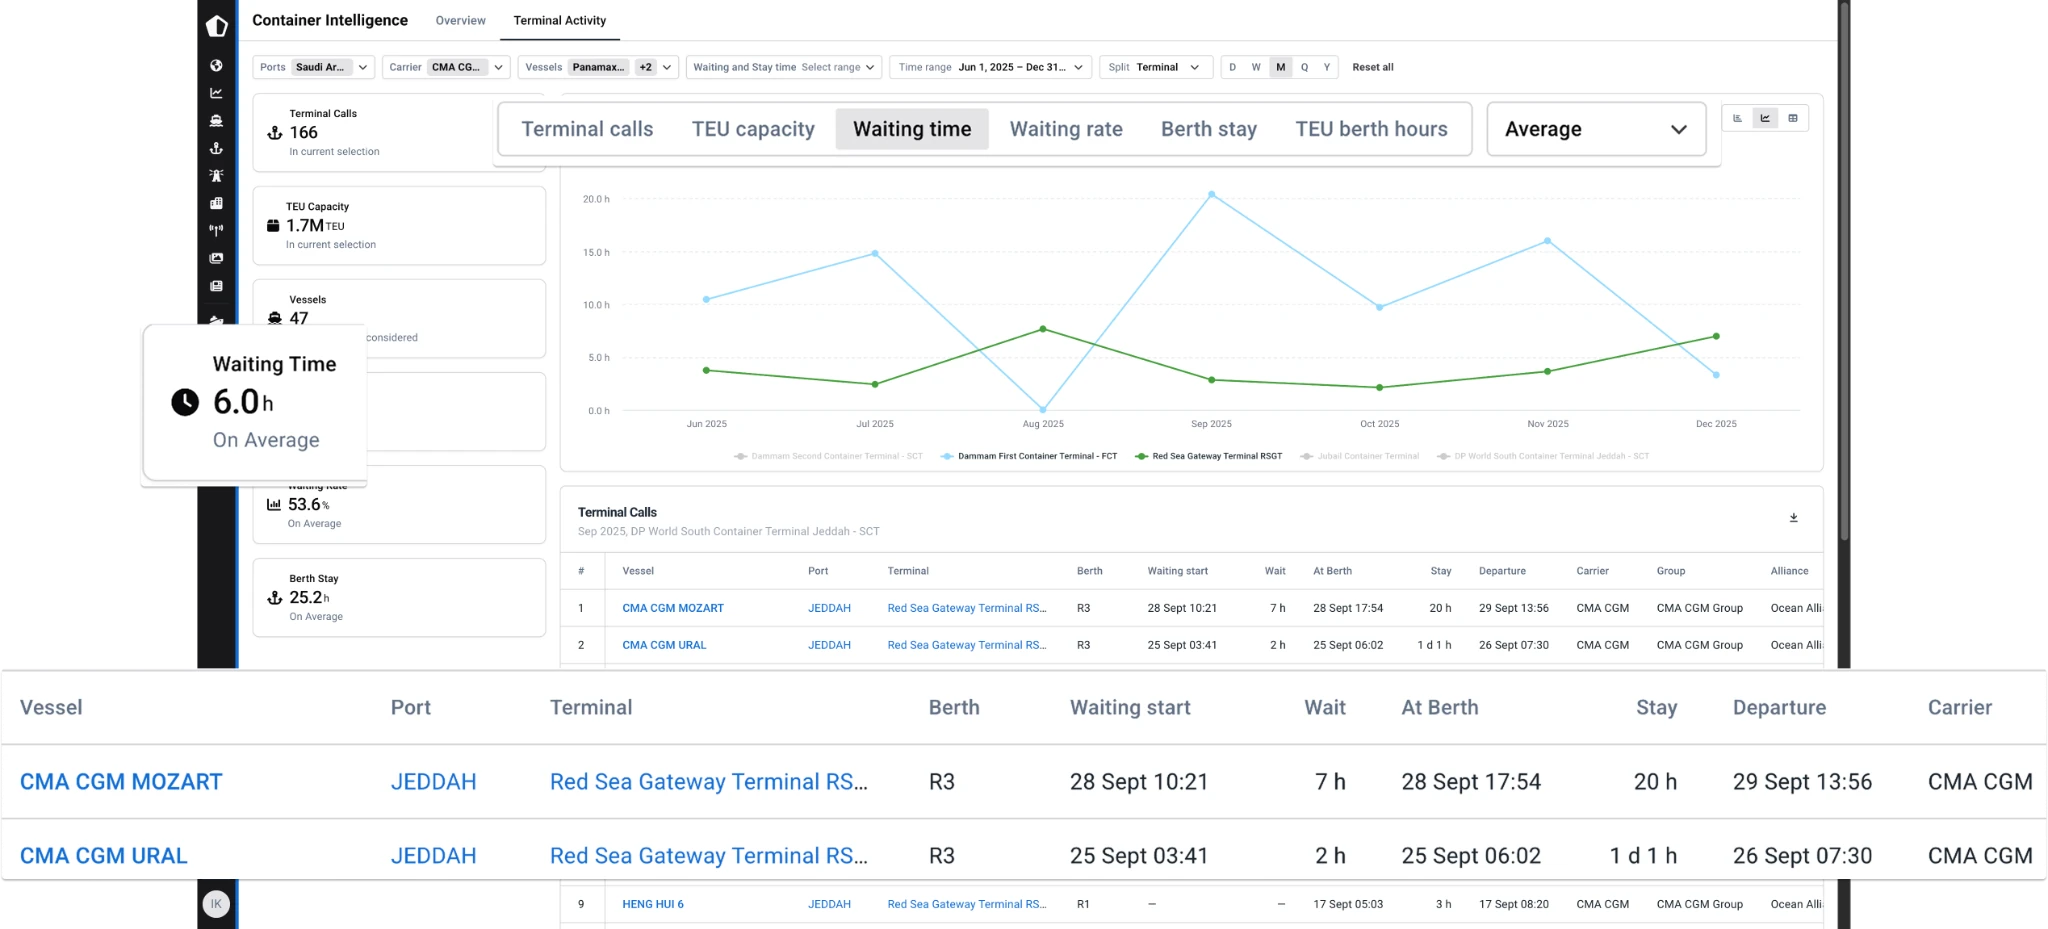
Dashboard of Container Intelligence showing terminal waiting time data with filters set for Saudi Arabia, CMA CGM carrier, Panamax vessels, time range June 1 to Dec 31, 2025, split by terminal. Chart plots waiting time in hours from June to December 2025 for Dammam First Container Terminal and Red Sea Gateway Terminal. On average waiting time displayed as 6.0 hours. Below the chart, a table lists vessel CMA CGM MOZART and CMA CGM URAL at Jeddah port, Red Sea Gateway Terminal R3 berth, with waiting start, wait time, at berth time, stay duration, departure, and carrier details.

Terminal commercial director

‍

Challenges

  • Carriers challenge your pricing and capex investment case. 
  • You have no independent evidence of how your terminal's dwell time, anchorage time, and vessel turnaround compare to peer terminals regionally.

‍

Solutions

  • Defend pricing and attract carrier volume with a neutral view of your competitive position against peer terminals by region and operator group. 
  • Underperformance becomes the strongest internal capex argument.
Request demo
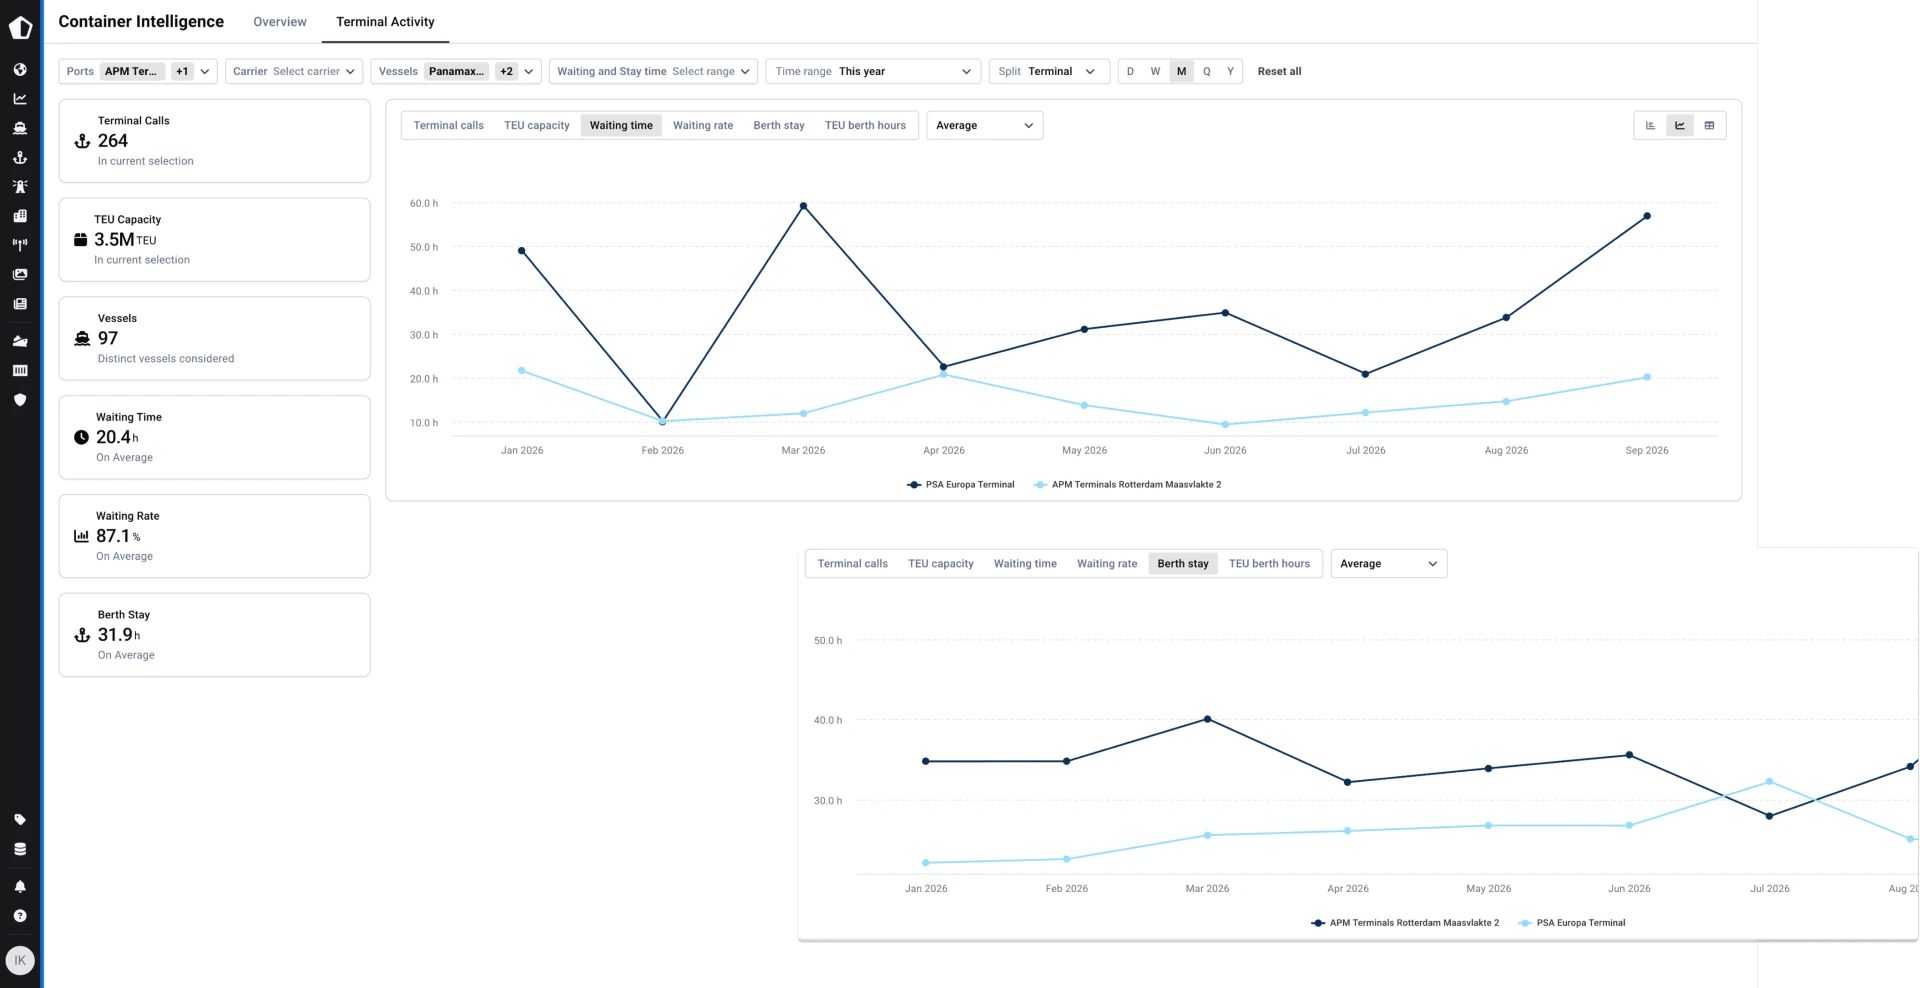
Data dashboard screenshot of Container Intelligence showing terminal activity metrics for selected APM terminals and Panamax vessels this year, including terminal calls (264), TEU capacity (3.5M TEU), vessels (97), average waiting time (20.4 h), waiting rate (87.1%), and average berth stay (31.9 h). Two line charts compare monthly average waiting time and berth stay hours between PSA Europa Terminal and APM Terminals Rotterdam Maasvlakte 2 from January to September 2026.

Terminal strategy & capex

‍

Challenges

  • Capex proposals stall at board level without independent evidence that your terminal's throughput and turnaround times lag competing facilities.
  • Internal performance data is compiled from your own operational records — the same records carriers and analysts will challenge the moment you present them.

‍

Solutions

  • Justify investment to the board with TEU×h load comparisons and waiting time trends versus competing terminals. 
  • Answer the question: "How do we compare to rivals?" with neutral data.
Request demo
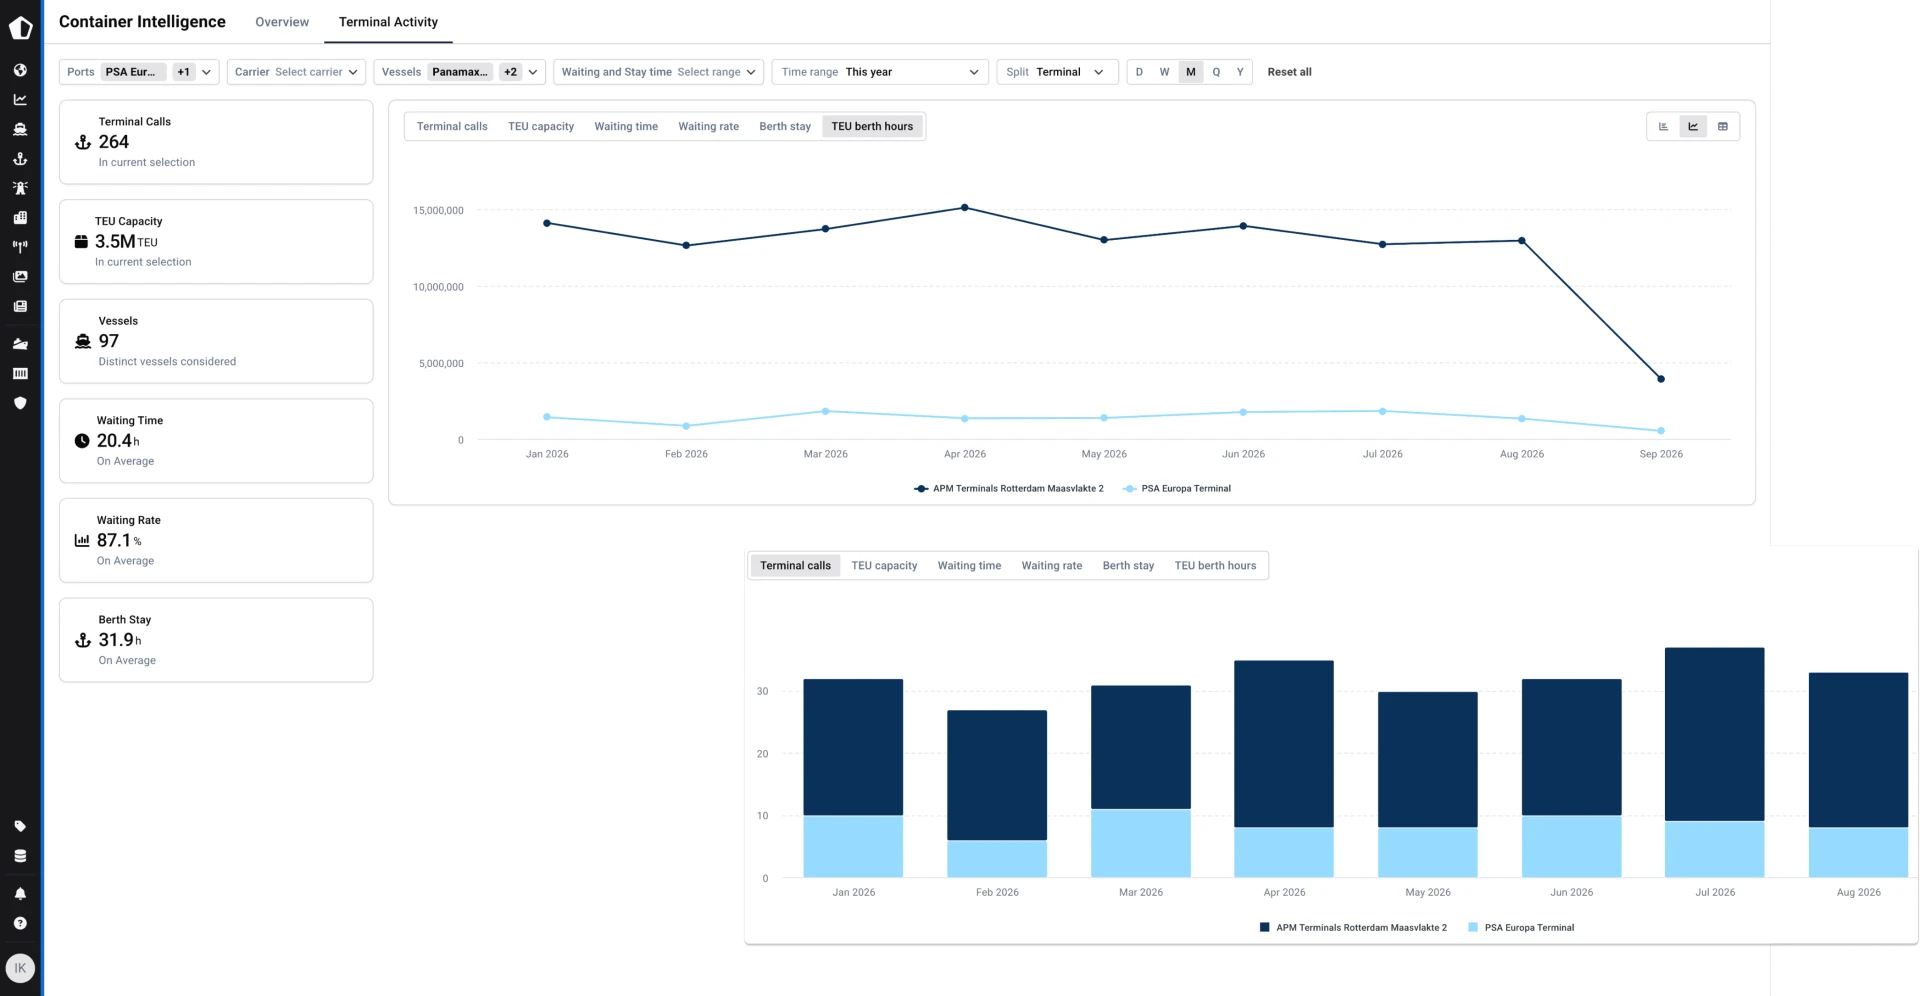
Dashboard titled Container Intelligence showing terminal activity for varying parameters filtered by ports, carrier, vessels, waiting and stay time for this year, split by terminal. On the left, summary boxes display terminal calls at 264, TEU capacity 3.5M TEU, 97 vessels, average waiting time 20.4 hours, waiting rate 87.1%, and average berth stay 31.9 hours. The top graph charts TEU berth hours from January to September 2026 for APM Terminals Rotterdam Maasvlakte 2 and PSA Europa Terminal, showing higher values for APM and a decline after August. The bottom graph shows terminal calls per month for the same terminals with APM calls consistently higher than PSA.

BCO ocean procurement

‍

Challenges

  • Carrier schedules obscure terminal-driven delay risk. 
  • Routing and carrier selection decisions carry hidden congestion exposure that only becomes visible after cargo is committed.

‍

Solutions

  • Factor terminal performance into carrier and routing decisions. 
  • Anticipate delays with port congestion data before cargo is committed
  • Anticipate congestion-driven delays before they hit your inbound supply chain or trigger D&D charges.
Request demo
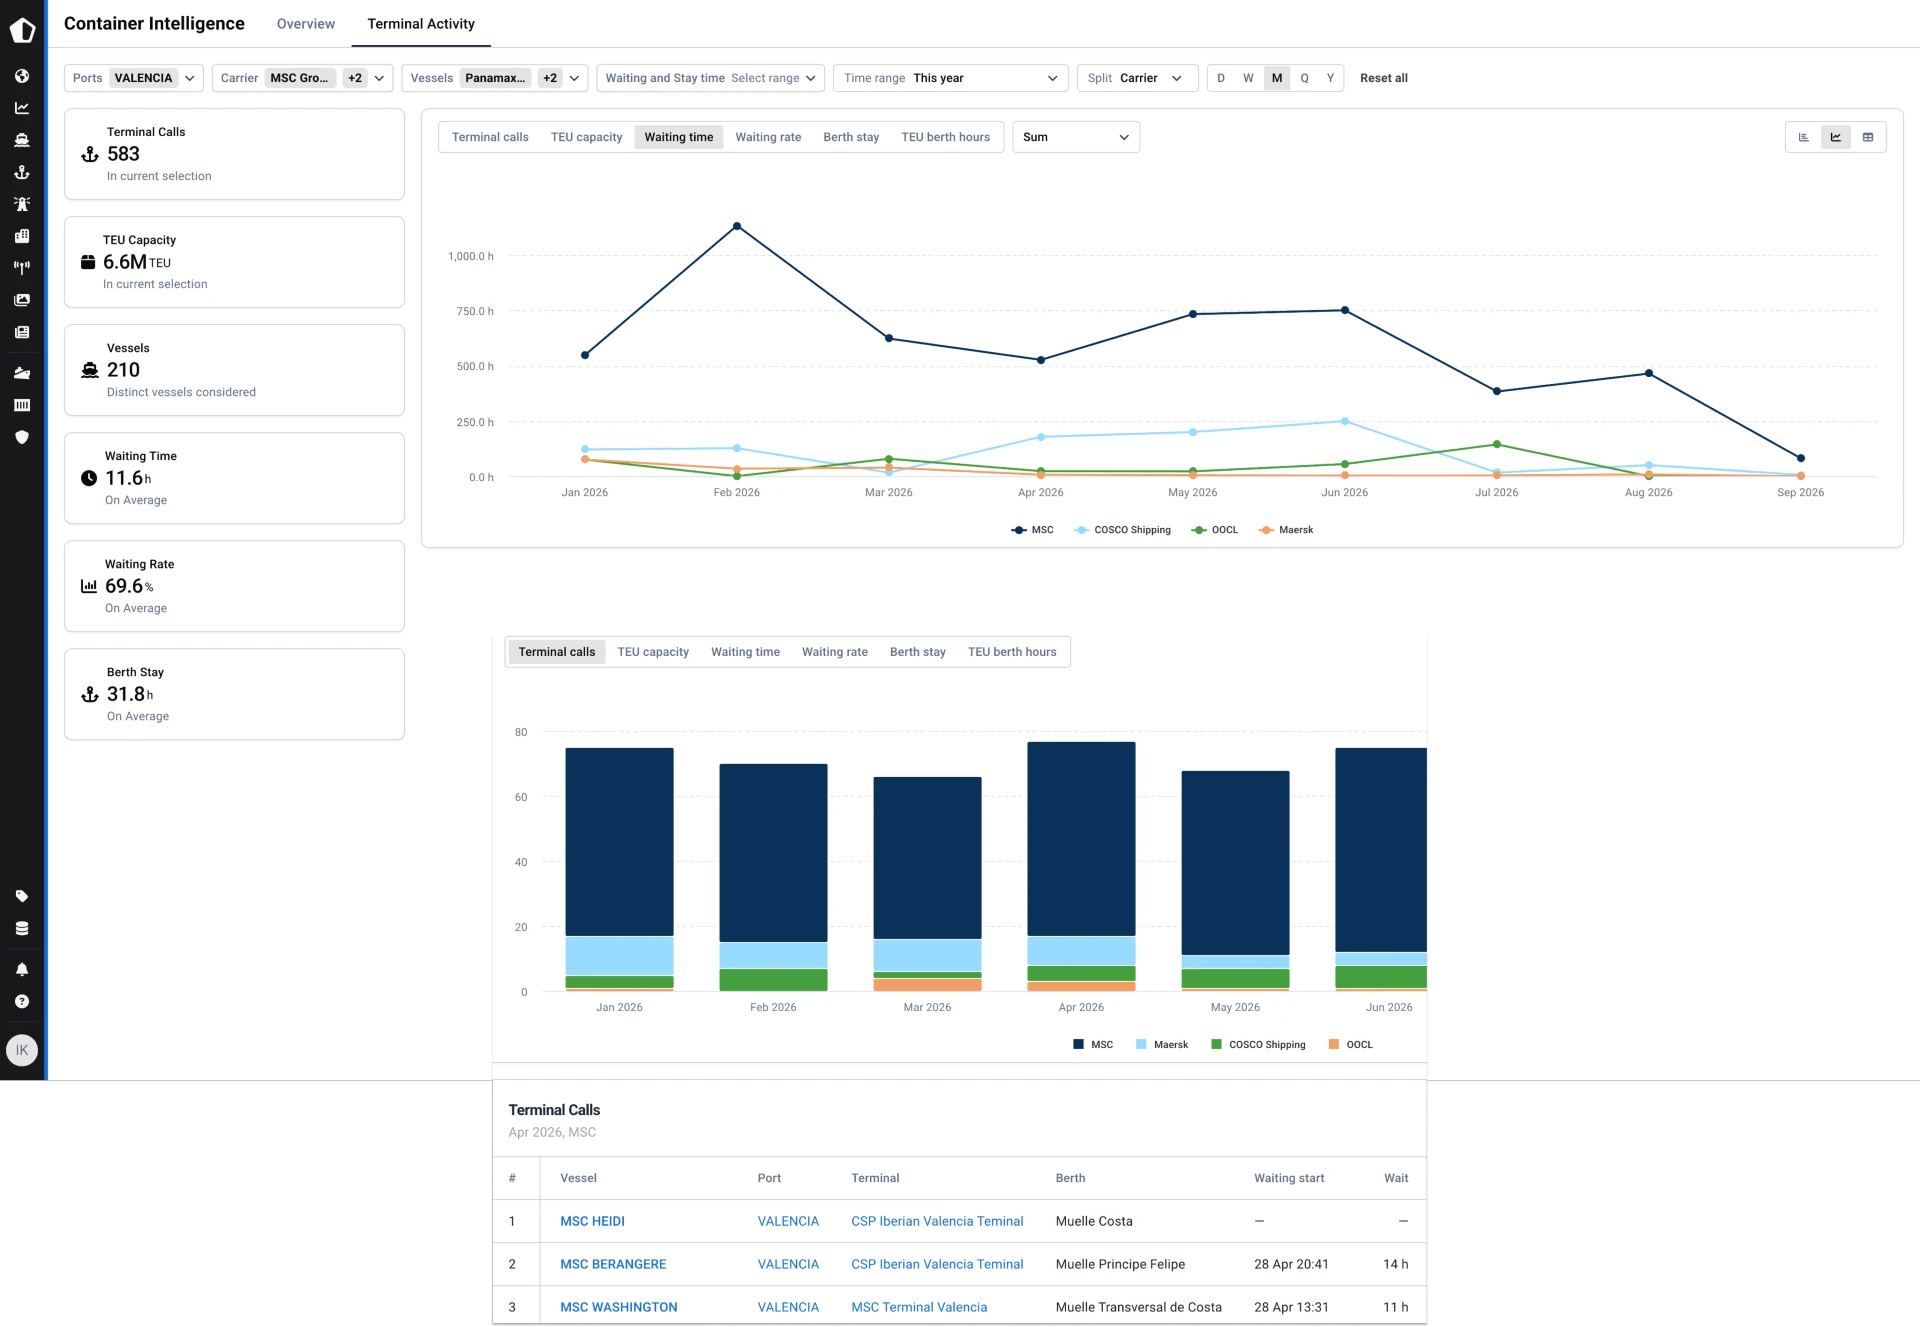
Dashboard titled 'Container Intelligence' showing terminal activity for Valencia port and MSC group carriers this year. The top chart is a line graph comparing waiting times in hours from January to September 2026 for MSC, COSCO Shipping, OOCL, and Maersk. MSC shows the highest waiting time peaking above 1000 hours in February. Left sidebar displays metrics: terminal calls 583, TEU capacity 6.6M, vessels 210, waiting time average 11.6h, waiting rate average 69.6%, berth stay average 31.8h. The middle chart is a stacked bar graph of terminal calls per month by carrier from January to June 2026, with MSC dominating. The bottom table lists three MSC vessels calling at Valencia port terminals in April 2026 with details on berth and waiting times.

The full picture in one workspace, from sea to berth

Every terminal performance metric, live vessel call, and disruption signal in a single workspace, so procurement, operations, and commercial teams act on the same independent data.

Terminal activity & performance
Walk into SLA and port rotation negotiations with third-party benchmark data your counterpart can verify. Computed from AIS and port geometries, not self-reported records. 
Global congestion map
See where congestion is building before it hits your port rotation. Live congestion index, vessels in queue, average waiting time, and berth stay.
Terminal calls, past, live & forecast
Know what every vessel is doing at every terminal, right now and six weeks out — full historical call records, live berth and anchorage status, predicted arrivals and departures, and forward carrier schedules.
Vessel-level operational view
Understand why a delay happened, not just that it did. Full voyage timeline with waiting and dwell durations, berth arrival and departure predictions, and carrier and service context.
Incidents layer
Catch disruptions before they become schedule delays. Live global feed of strikes, weather events, geopolitical conflicts, and port accidents — colour-coded by severity and refreshed every three hours.

“We had no real-time visibility on our container shipments. Now, we can proactively manage disruptions before they impact production.”

Alexandre Royer
Inbound Process Engineering, Renault Group

“Shipment insights are accurate and updated in just a few minutes.”

Keerthi Subawickrama
Import / Export Manager

“Initially, our goal was to track around 175,000 containers a year. Since then, customers have grown and we’re tracking upwards of around 1 million containers a year.”

Bob Broome
VP of eSolutions

“The accurate, real-time tracking of our shipments ensures that we can provide our customers with precise delivery estimates, which is crucial for their cash flow planning.”

Lizette du Plooy
Logistics Manager, Green Farms Nut Company

Explore our case studies for maritime markets

CFC
CFC modernises marine kidnap & ransom insurance with live vessel intelligence
Download PDF
Unilever
Unilever powers its Virtual Ocean Control Tower with advanced AIS data
Download PDF
Renault
Renault optimises just-in-time production for 100k shipments with precise vessel data
Download PDF
Johnasia
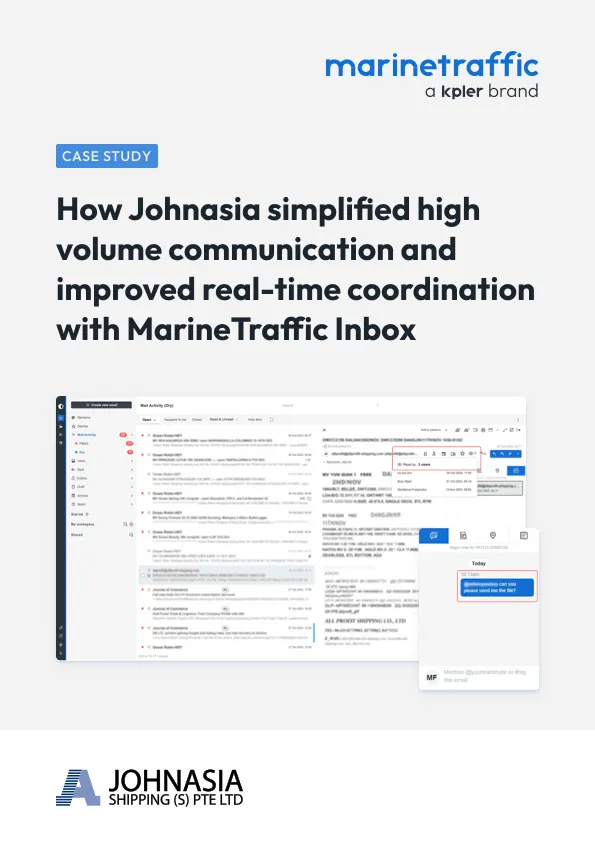
Johnasia simplifies high-volume communication and coordination with MarineTraffic Inbox
Download PDF
CFC
CFC modernises marine kidnap & ransom insurance with live vessel intelligence
Download PDF
Unilever
Unilever powers its Virtual Ocean Control Tower with advanced AIS data
Download PDF
Renault
Renault optimises just-in-time production for 100k shipments with precise vessel data
Download PDF
Johnasia
Johnasia simplifies high-volume communication and coordination with MarineTraffic Inbox
Download PDF
How does Container Intelligence differ from annual port rankings?

Annual port rankings publish port-level averages once a year, with no carrier, alliance, or service granularity. Container Intelligence refreshes daily through live, at terminal and berth level, split by carrier, alliance, tradelane, and TEU size class — derived independently from AIS rather than survey or self-report.

How does Kpler define waiting time versus berth time?

At the terminal-call level, berth time is ATA (actual time of arrival at berth) to ATD (actual time of departure); waiting time is the observed pre-berth anchorage wait, which can be zero. In-progress calls are excluded until complete so figures are never distorted by open calls. Full definitions are on the published methodology page linked from the Container Intelligence UI.

Can terminal operators see how their performance compares to competing terminals?

Yes. Container Intelligence benchmarks each terminal against regional peers and operator groups, split by TEU size class and carrier. Terminals can identify where they underperform — and use that gap as internal justification for capex — or where they outperform, and lead with that evidence in carrier negotiations.

How do carriers use terminal performance data in port rotation negotiations?

Carriers use independent terminal benchmarks — waiting time, berth time, and call volume by vessel size class — to challenge SLA terms and justify port rotation changes. Because the data is derived from AIS rather than either party's operational records, it can be presented as neutral evidence in berth window and rotation discussions.

How far back does Terminal Activity history go?

Systematic processing began on 1 January 2026, so depth builds every month. For SLA negotiations and performance benchmarking, recent quarters carry the weight. Aggregation is available daily through yearly.

Will Kpler waiting time figures match our operational records?

No, and that's to be expected, as every party measures from their own vantage point. Kpler figures are computed identically for every terminal and carrier worldwide, from observed vessel behaviour, with a published methodology and call count displayed on every view. It is the only figure both sides of a negotiation can independently verify.
Other fundamental intelligence solutions

Containers solutions

We also cover

Chartering
Chartering
Trader Tools
Trader Tools
Market Insights
Market Insights
Defense Intelligence
Risk & Compliance
Risk & Compliance